TuGraph Browser(old version)
This document focuses on the use of TuGraph Browser
Definition
TuGraph Browser is a visual development tool provided by TuGraph.
Functionality
TuGraph Browser provides graph database developers with functions such as visual graph data development, graph data management and maintenance.
How to use it
1. Connect to the database
When the user completes the installation of the graph database, you can access it through the Browser, TuGraph Browser tool. The user only needs to type in the browser address bar: IP of the server where TuGraph is located :Port. The default port is 7090.
2. Login
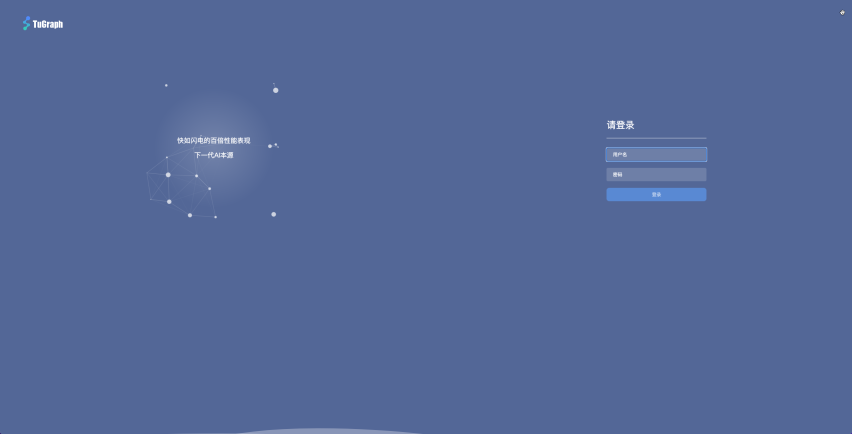
When the page is opened successfully, the first thing you see is the login page, and the user needs to fill in the account number and password to log in.
Default account: admin
Default password: 73@TuGraph
It is recommended that users change the initialized password in time after logging in
3. Workbench
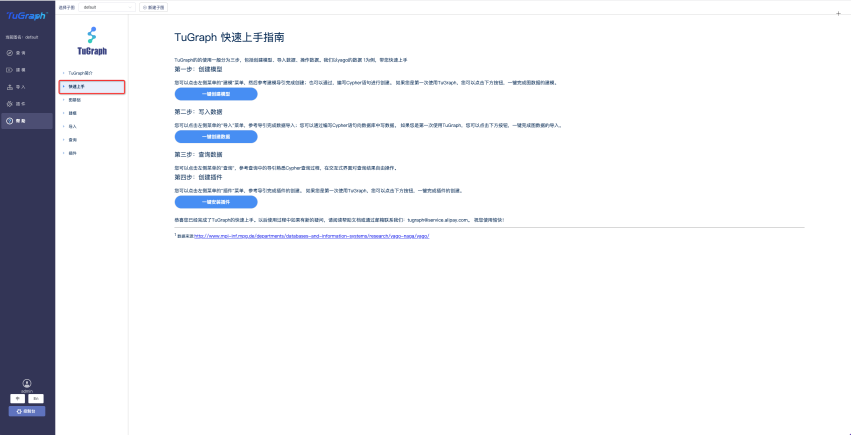
3.1 Quick Start
When you log in for the first time, the system will create an empty graph by default
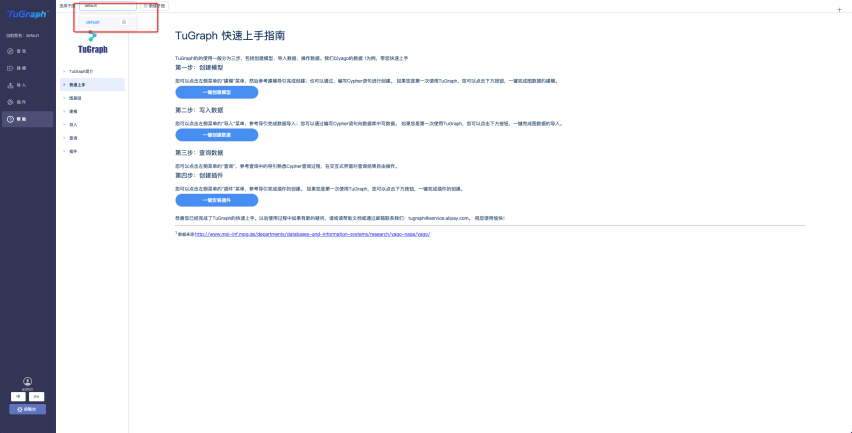
The user clicks on the help option and selects Get Started quickly
Then click “One-click Create Model” – >” One-click Create Data “to complete the construction of the built-in Movie data graph
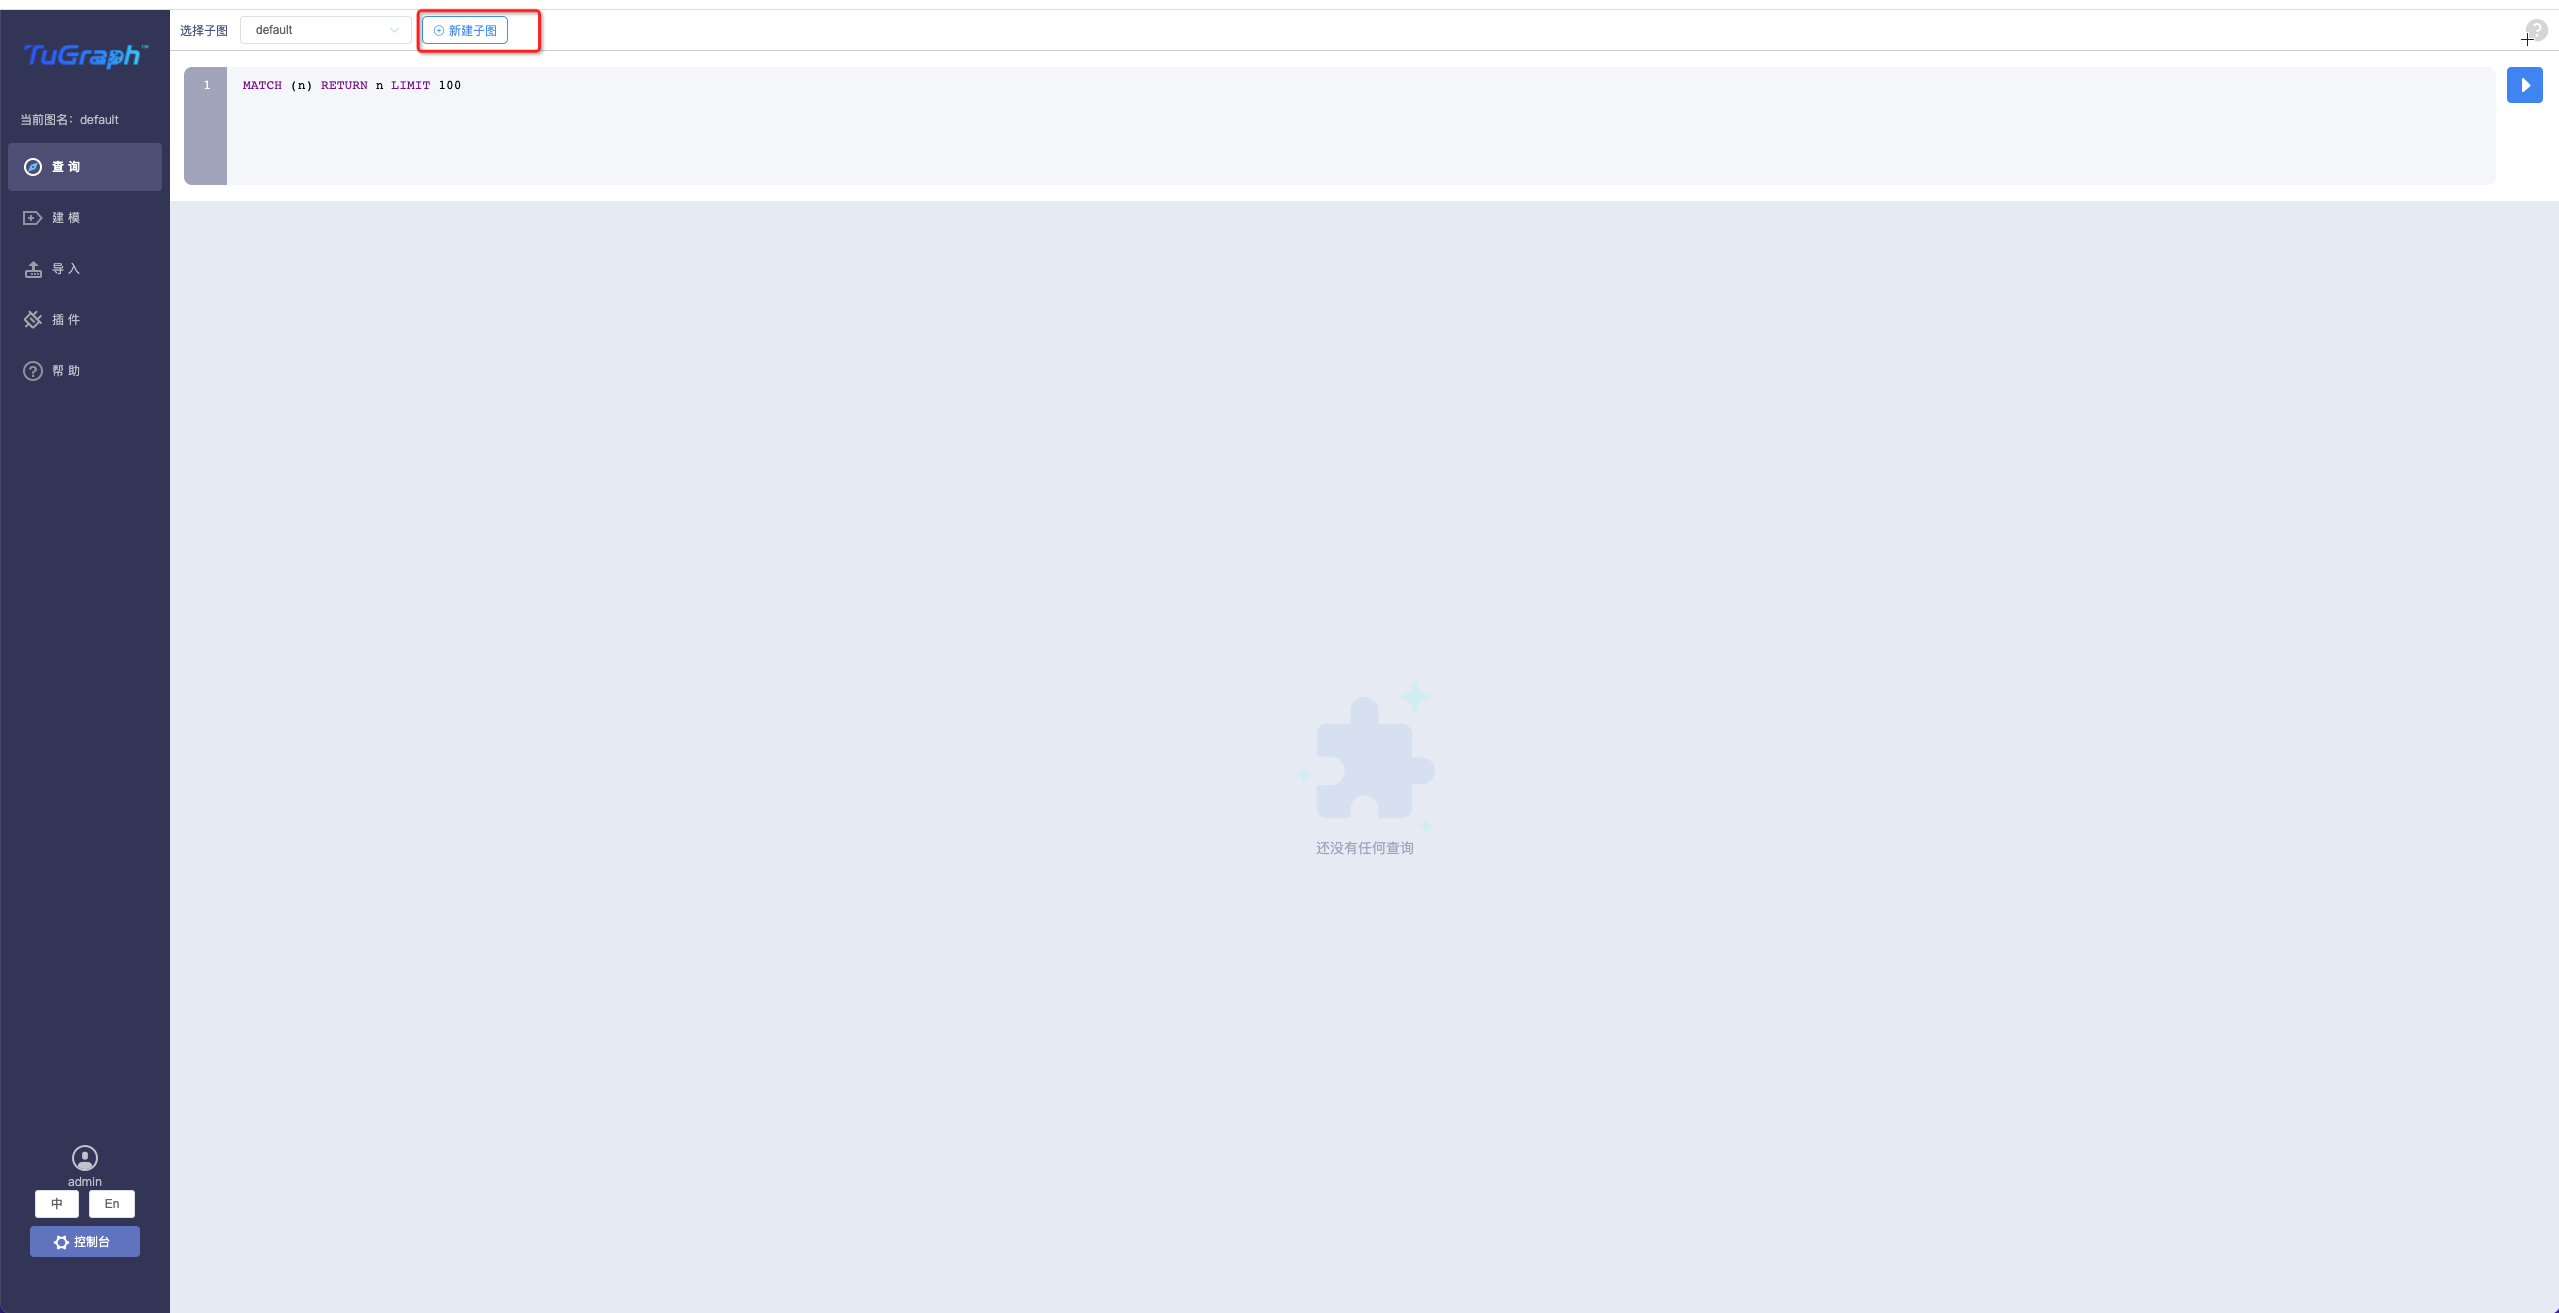
3.2 Create subgraphs and examples
3.2.1 Create a subgraph
Click on New subgraph
Fill in the form information
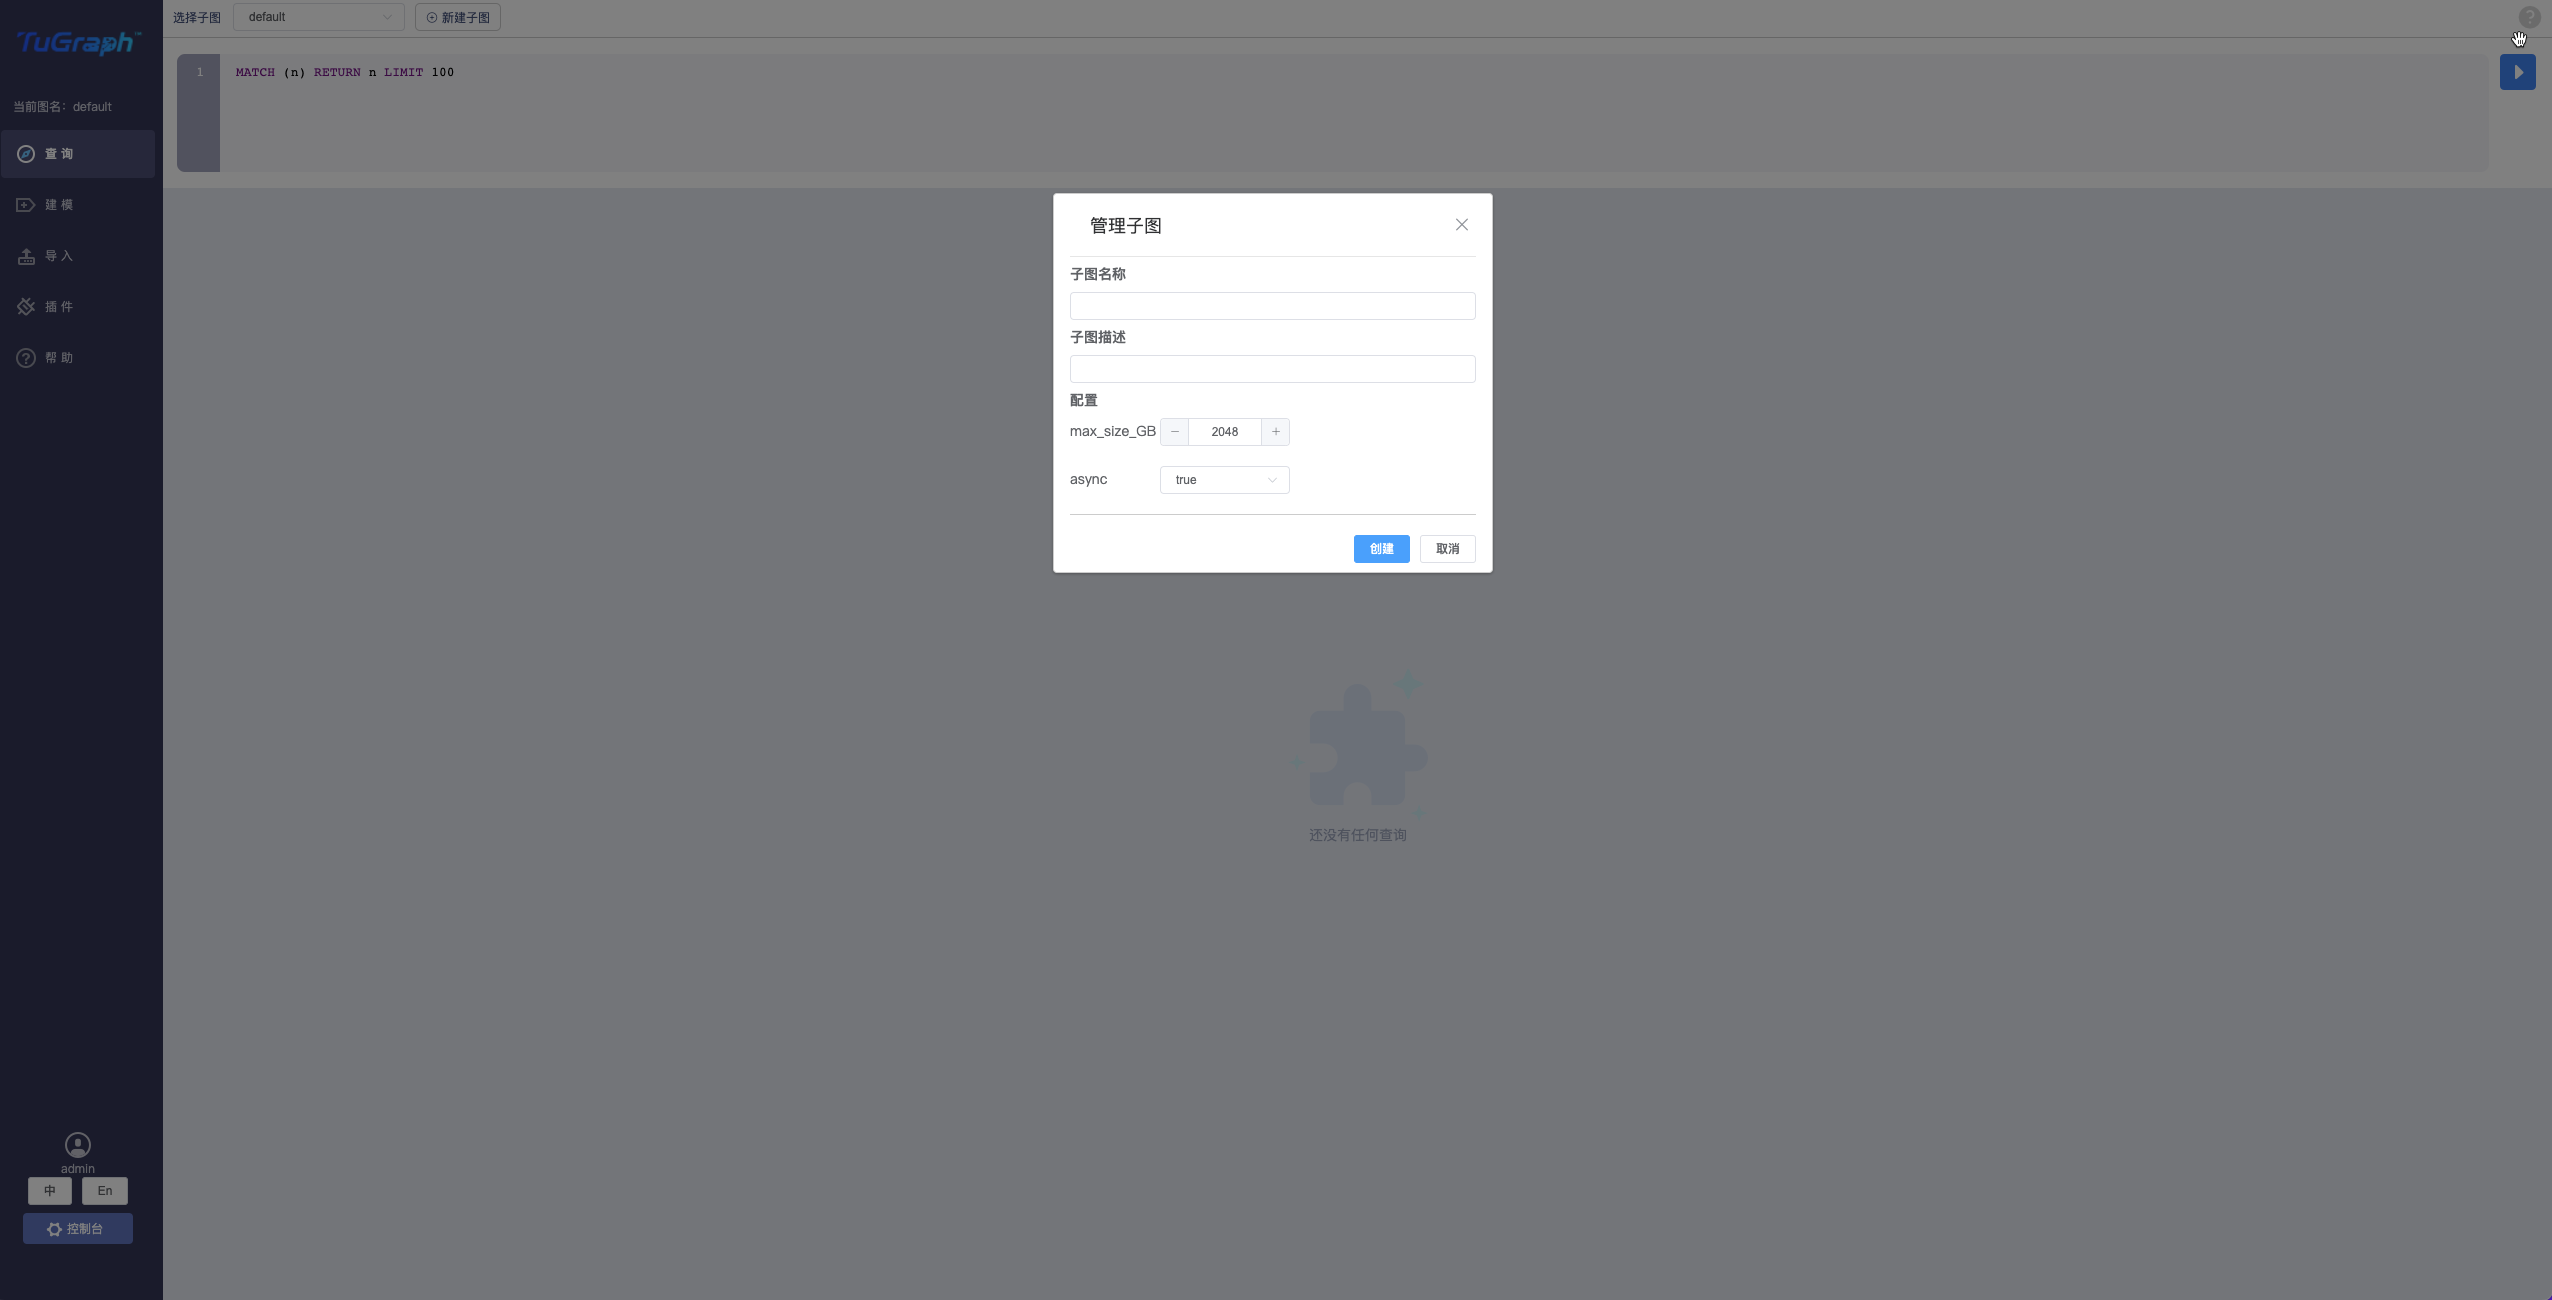
Subgraph name
Subgraph description
Configuration information
Click OK to prompt that creation succeeded
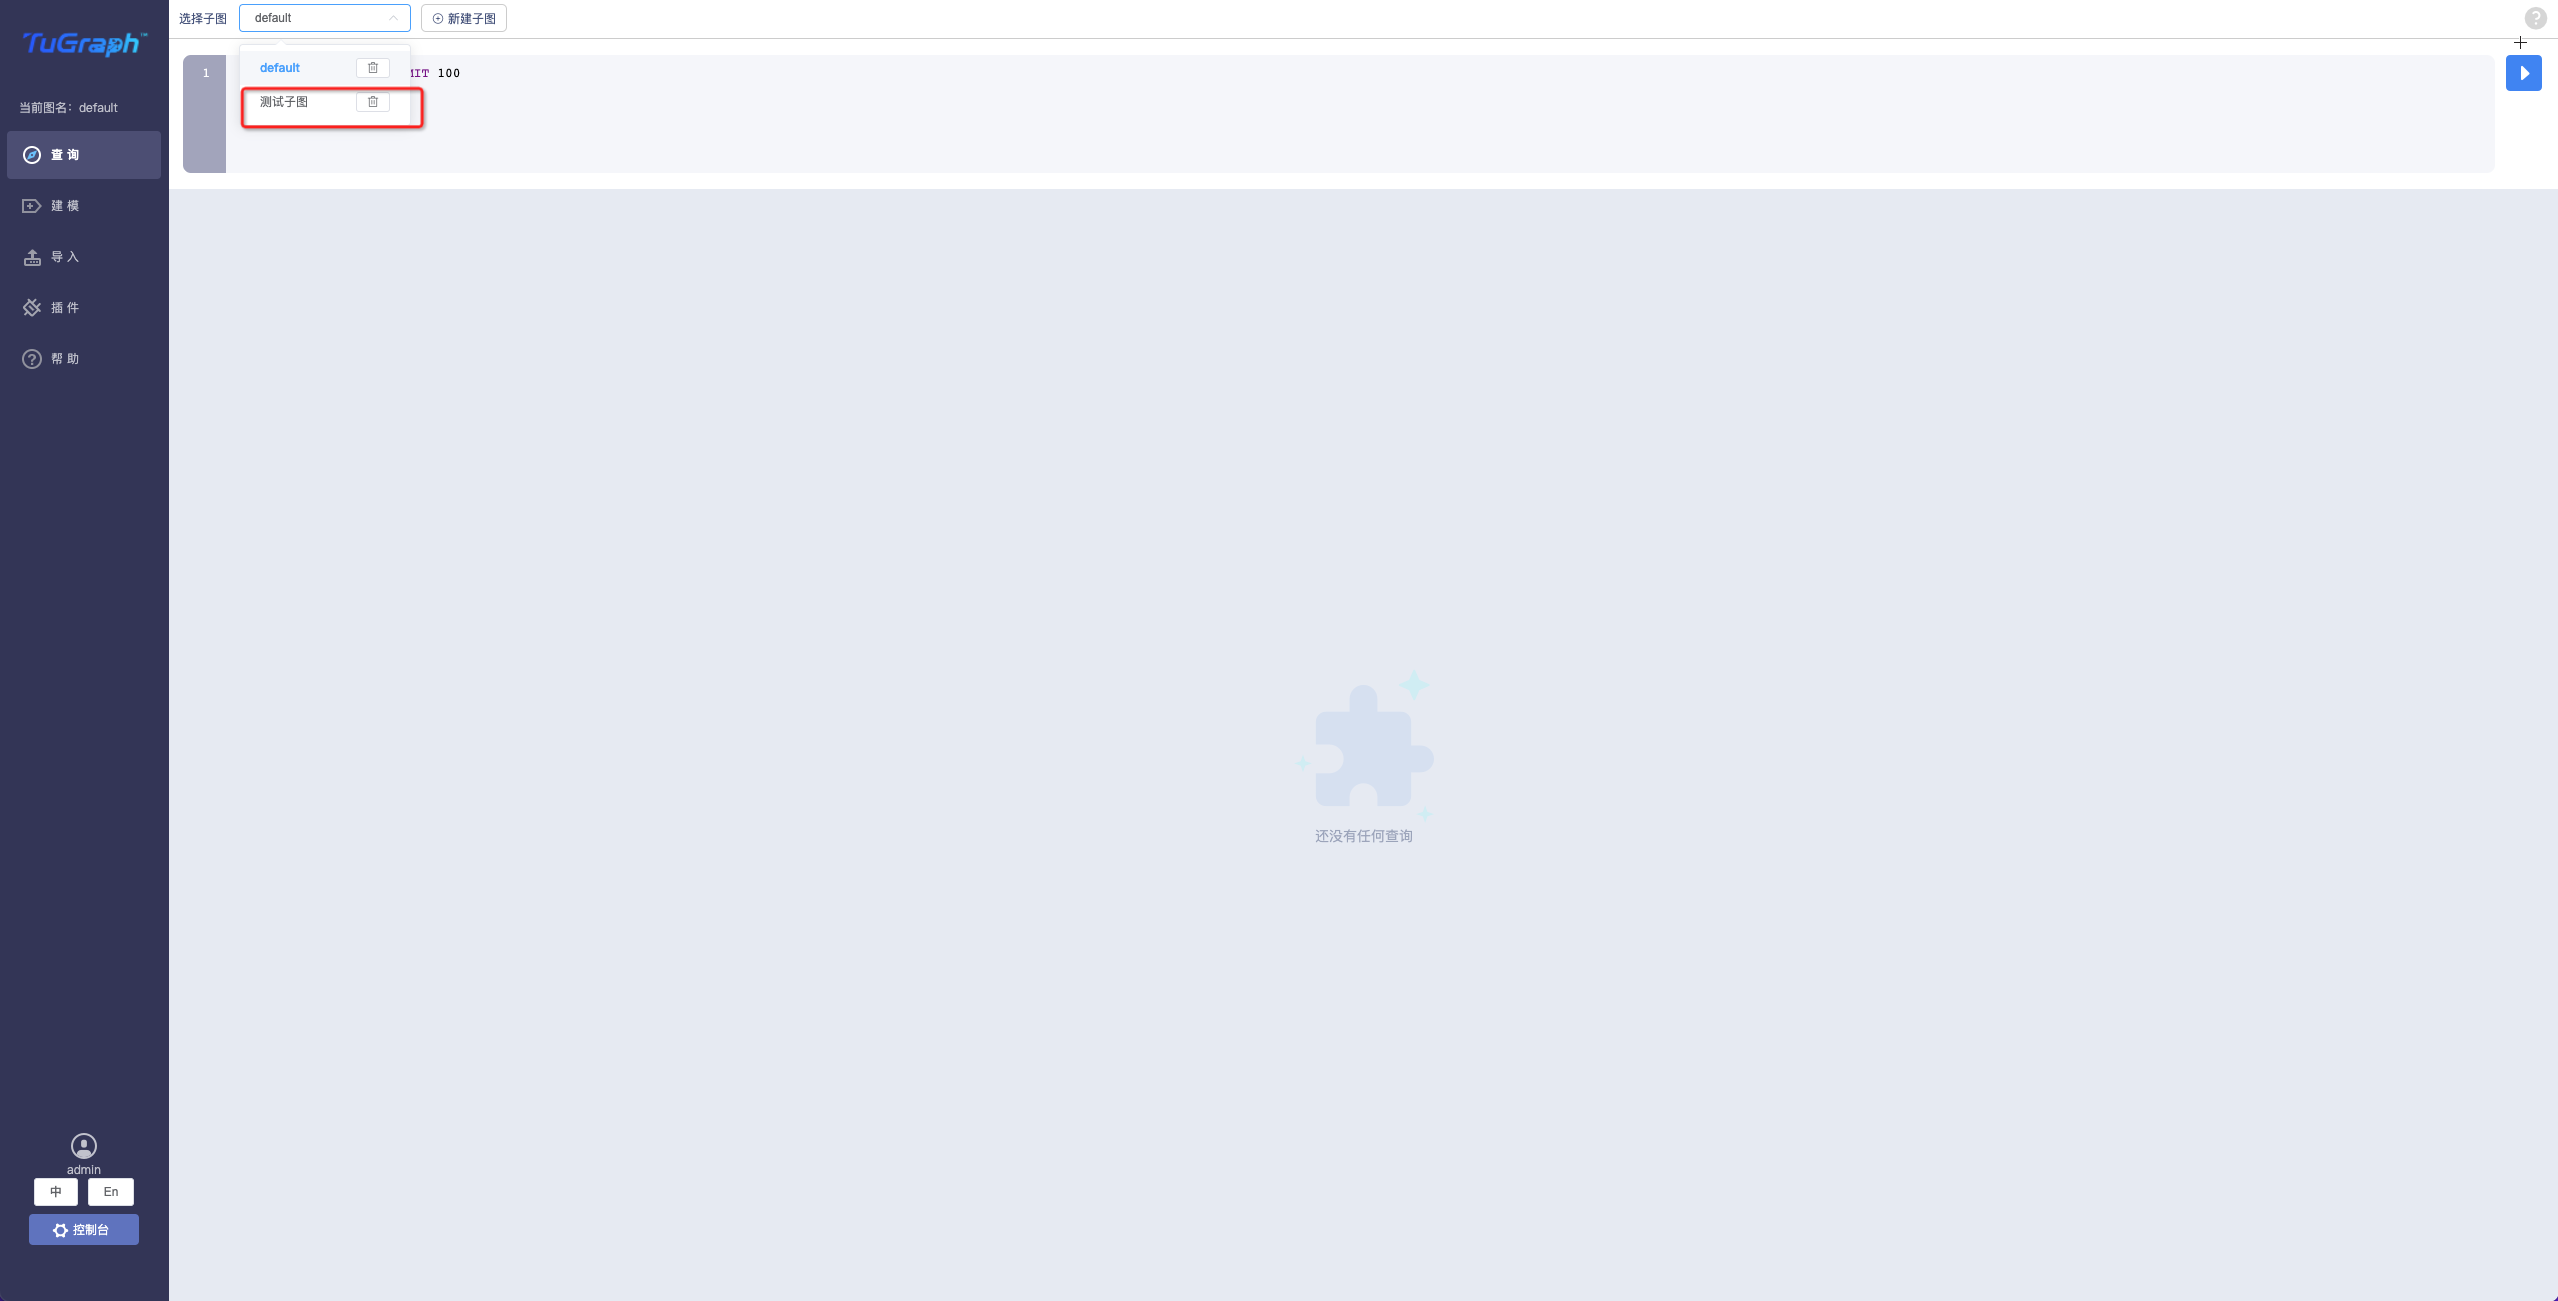
Toggle the subgraph
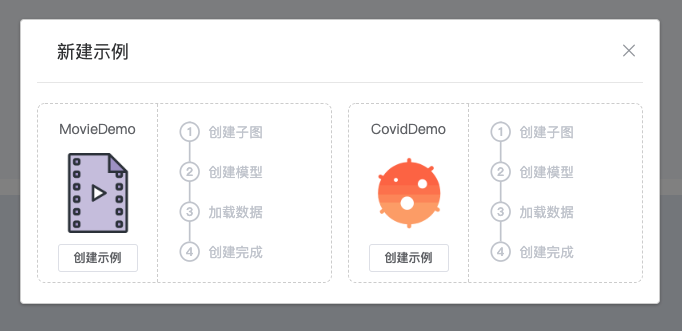
Click New Example
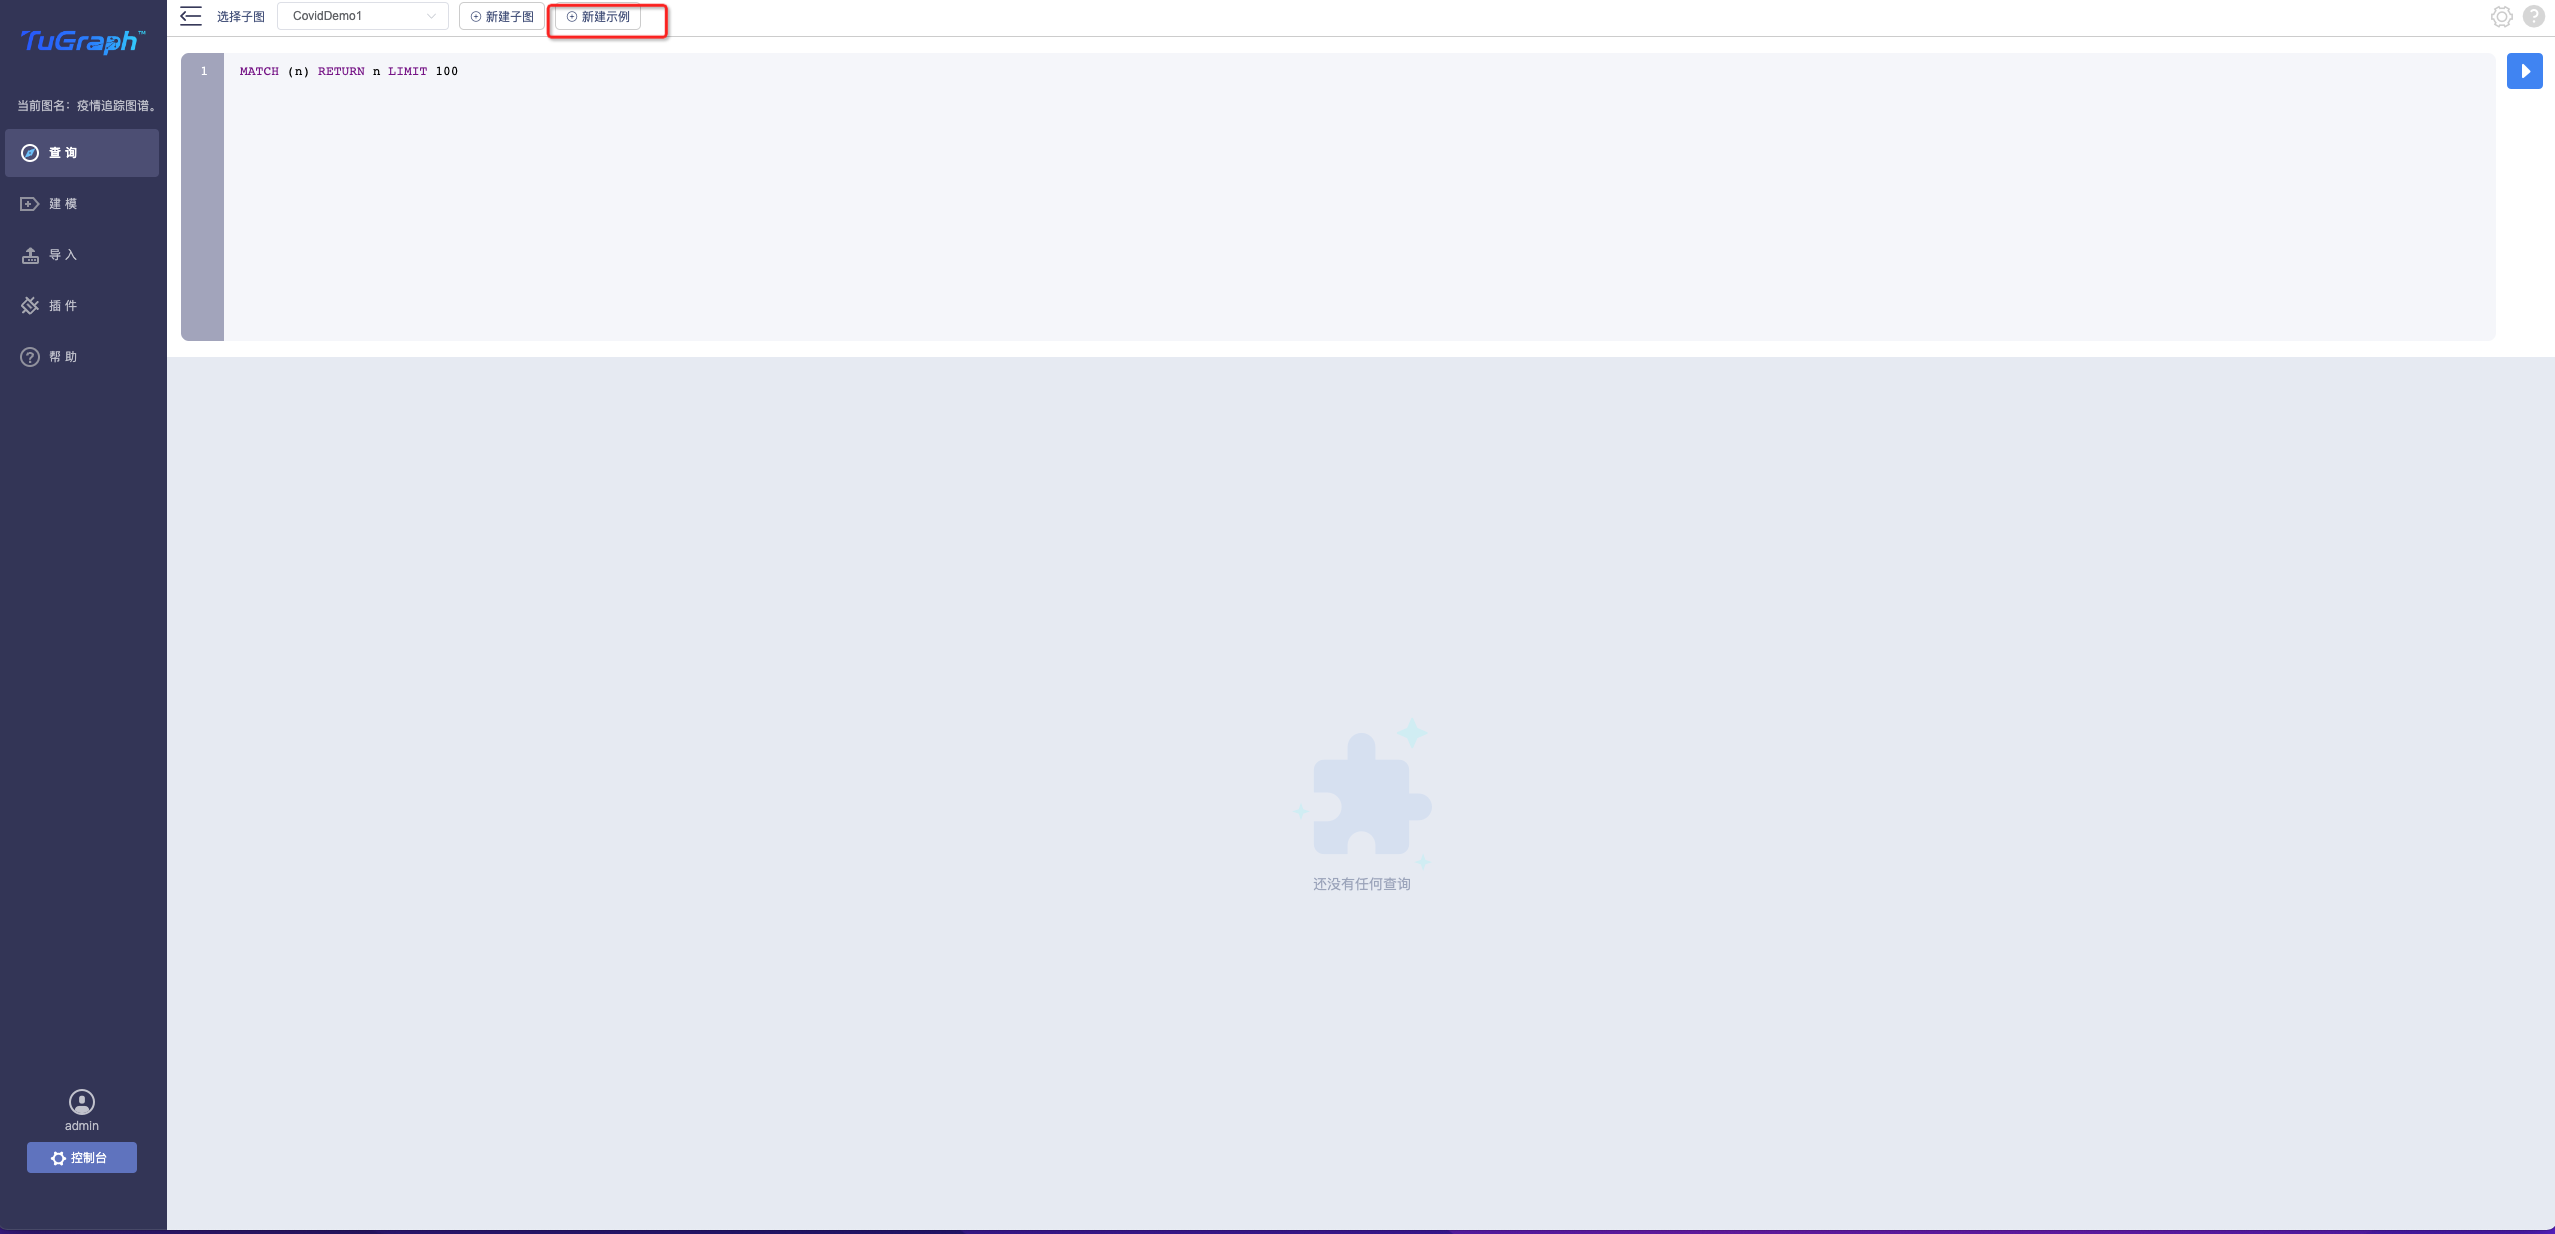
Select the example and click Create
3.3 query
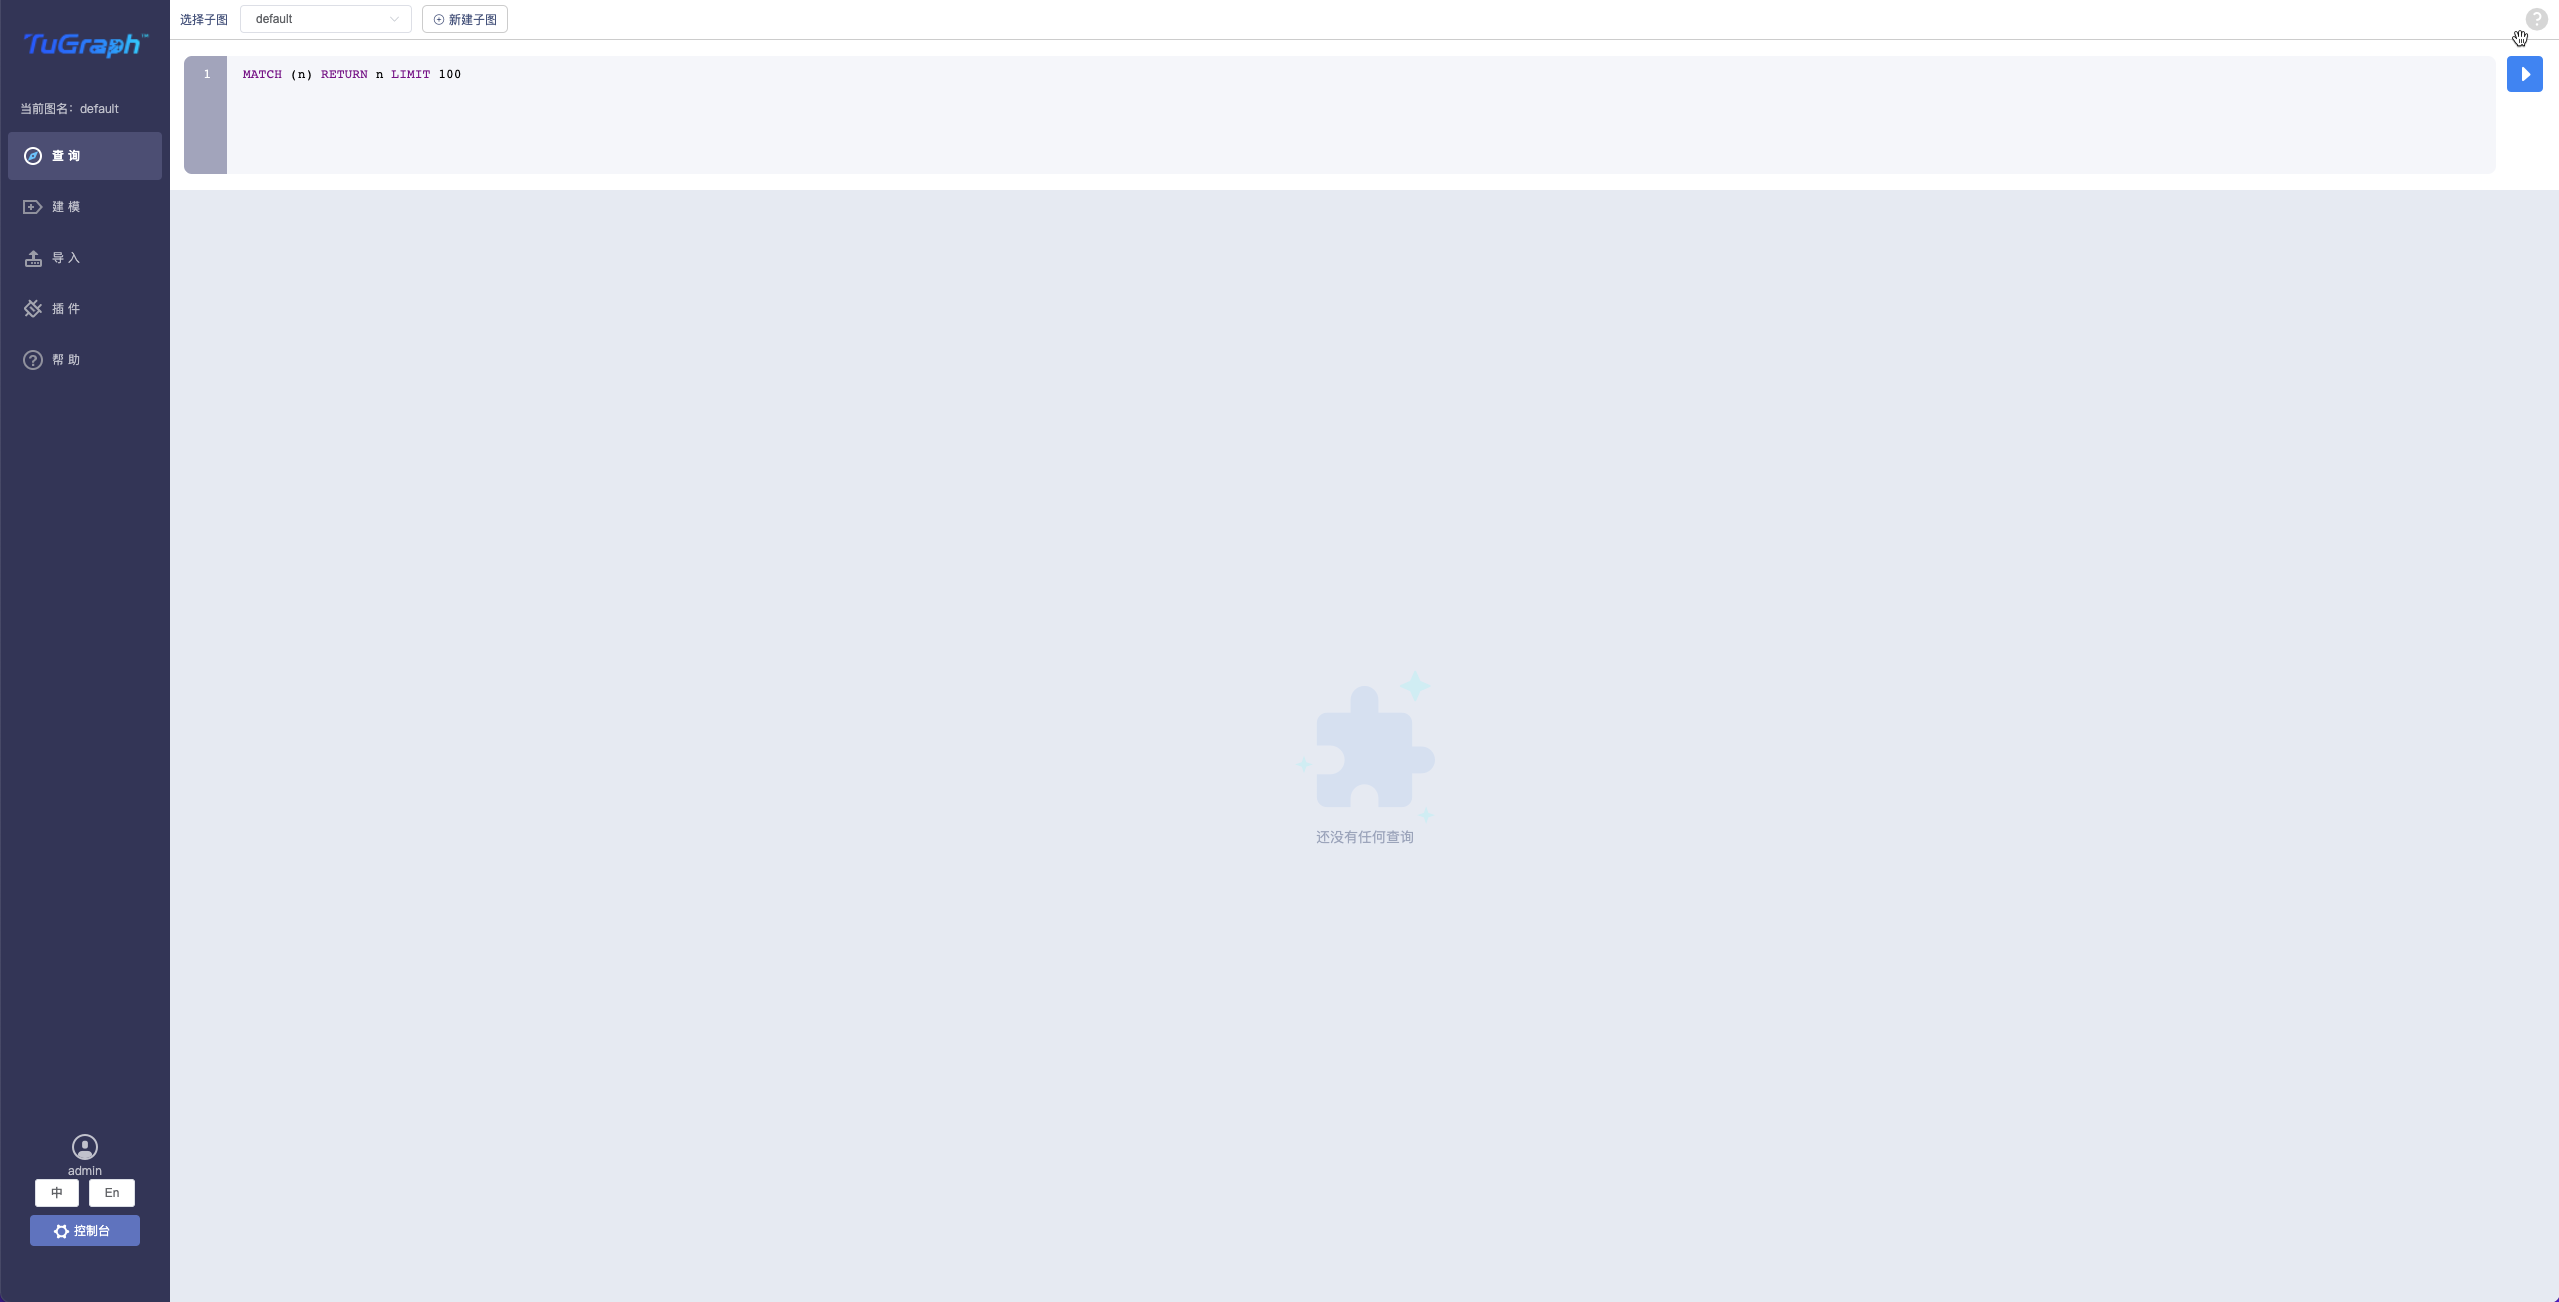
3.3.1 User Interface Layout
Cypher input box
Result set display area
3.3.2 Result set display area function details
Result set tag display and functions
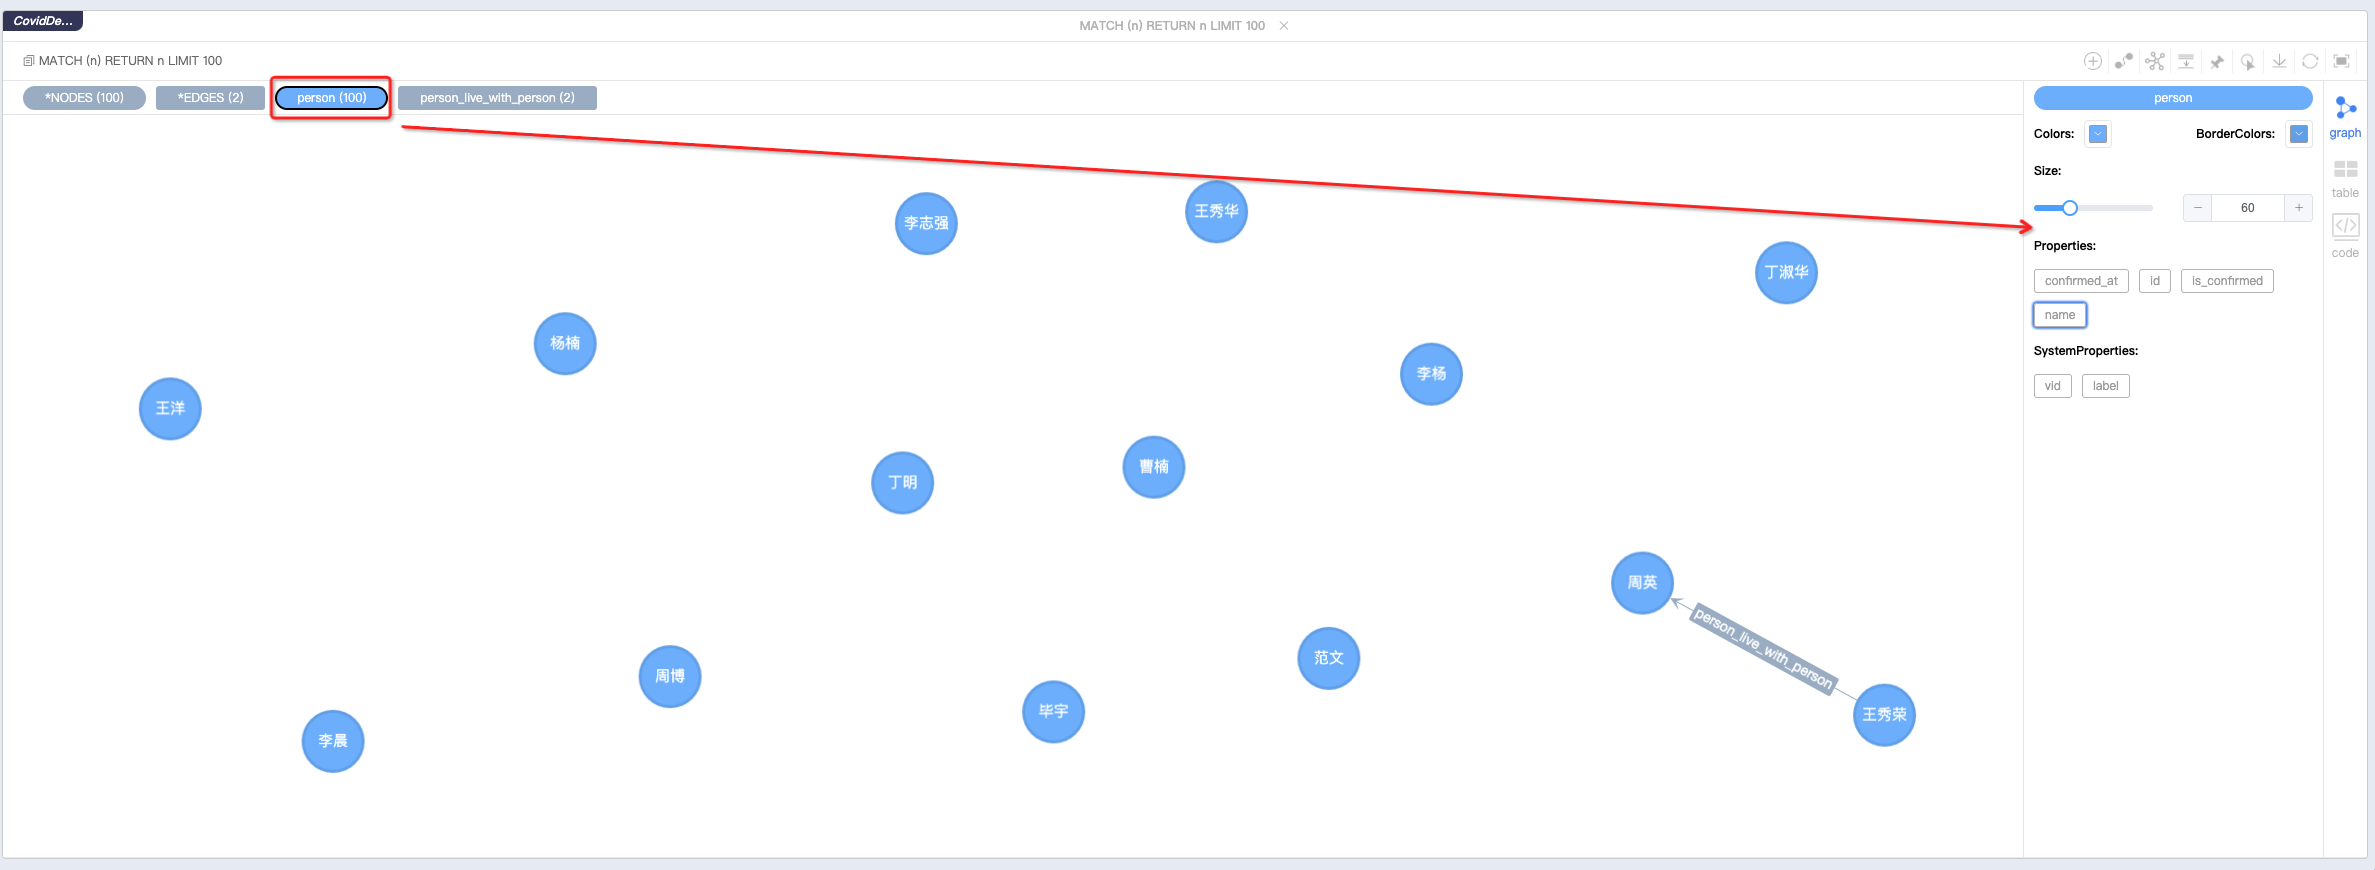
All types of statistics for the result set are shown here
Click on the different “label” to make the following changes -Change the display color
Modify the node size or edge thickness
Modify default display properties or system properties
Layout modification
Force guide layout
Grid layout
Tree layout
Environment layout
edge polymerization
Edges of the same type and direction can be merged
Create nodes
Click the Create Node button
Select the node type
Add node content
Create relationships
Select start and end points in the canvas
Select the type that can be matched
Enter node information
Stop layout
When too much data is causing the browser page to stall, you can click this stop layout button to improve the smoothness of the experience
Mouse hover
Enable this feature to highlight the one-degree neighbors of the mouse-over node
Result set export
Result sets can be exported as png, json, csv three different file forms
the refresh
Clicking the refresh button will re-execute the initial cypher statement for the current page and refresh the result set Maximize - -Click Maximize button, the result set display area will be displayed in full screen
Result set display mode switching
Support graph, table and text modes
3.3.3 Schema
model

schema supports real-time addition, deletion, modification and query
schema supports import and export
3.3.4 Data import
Local data import
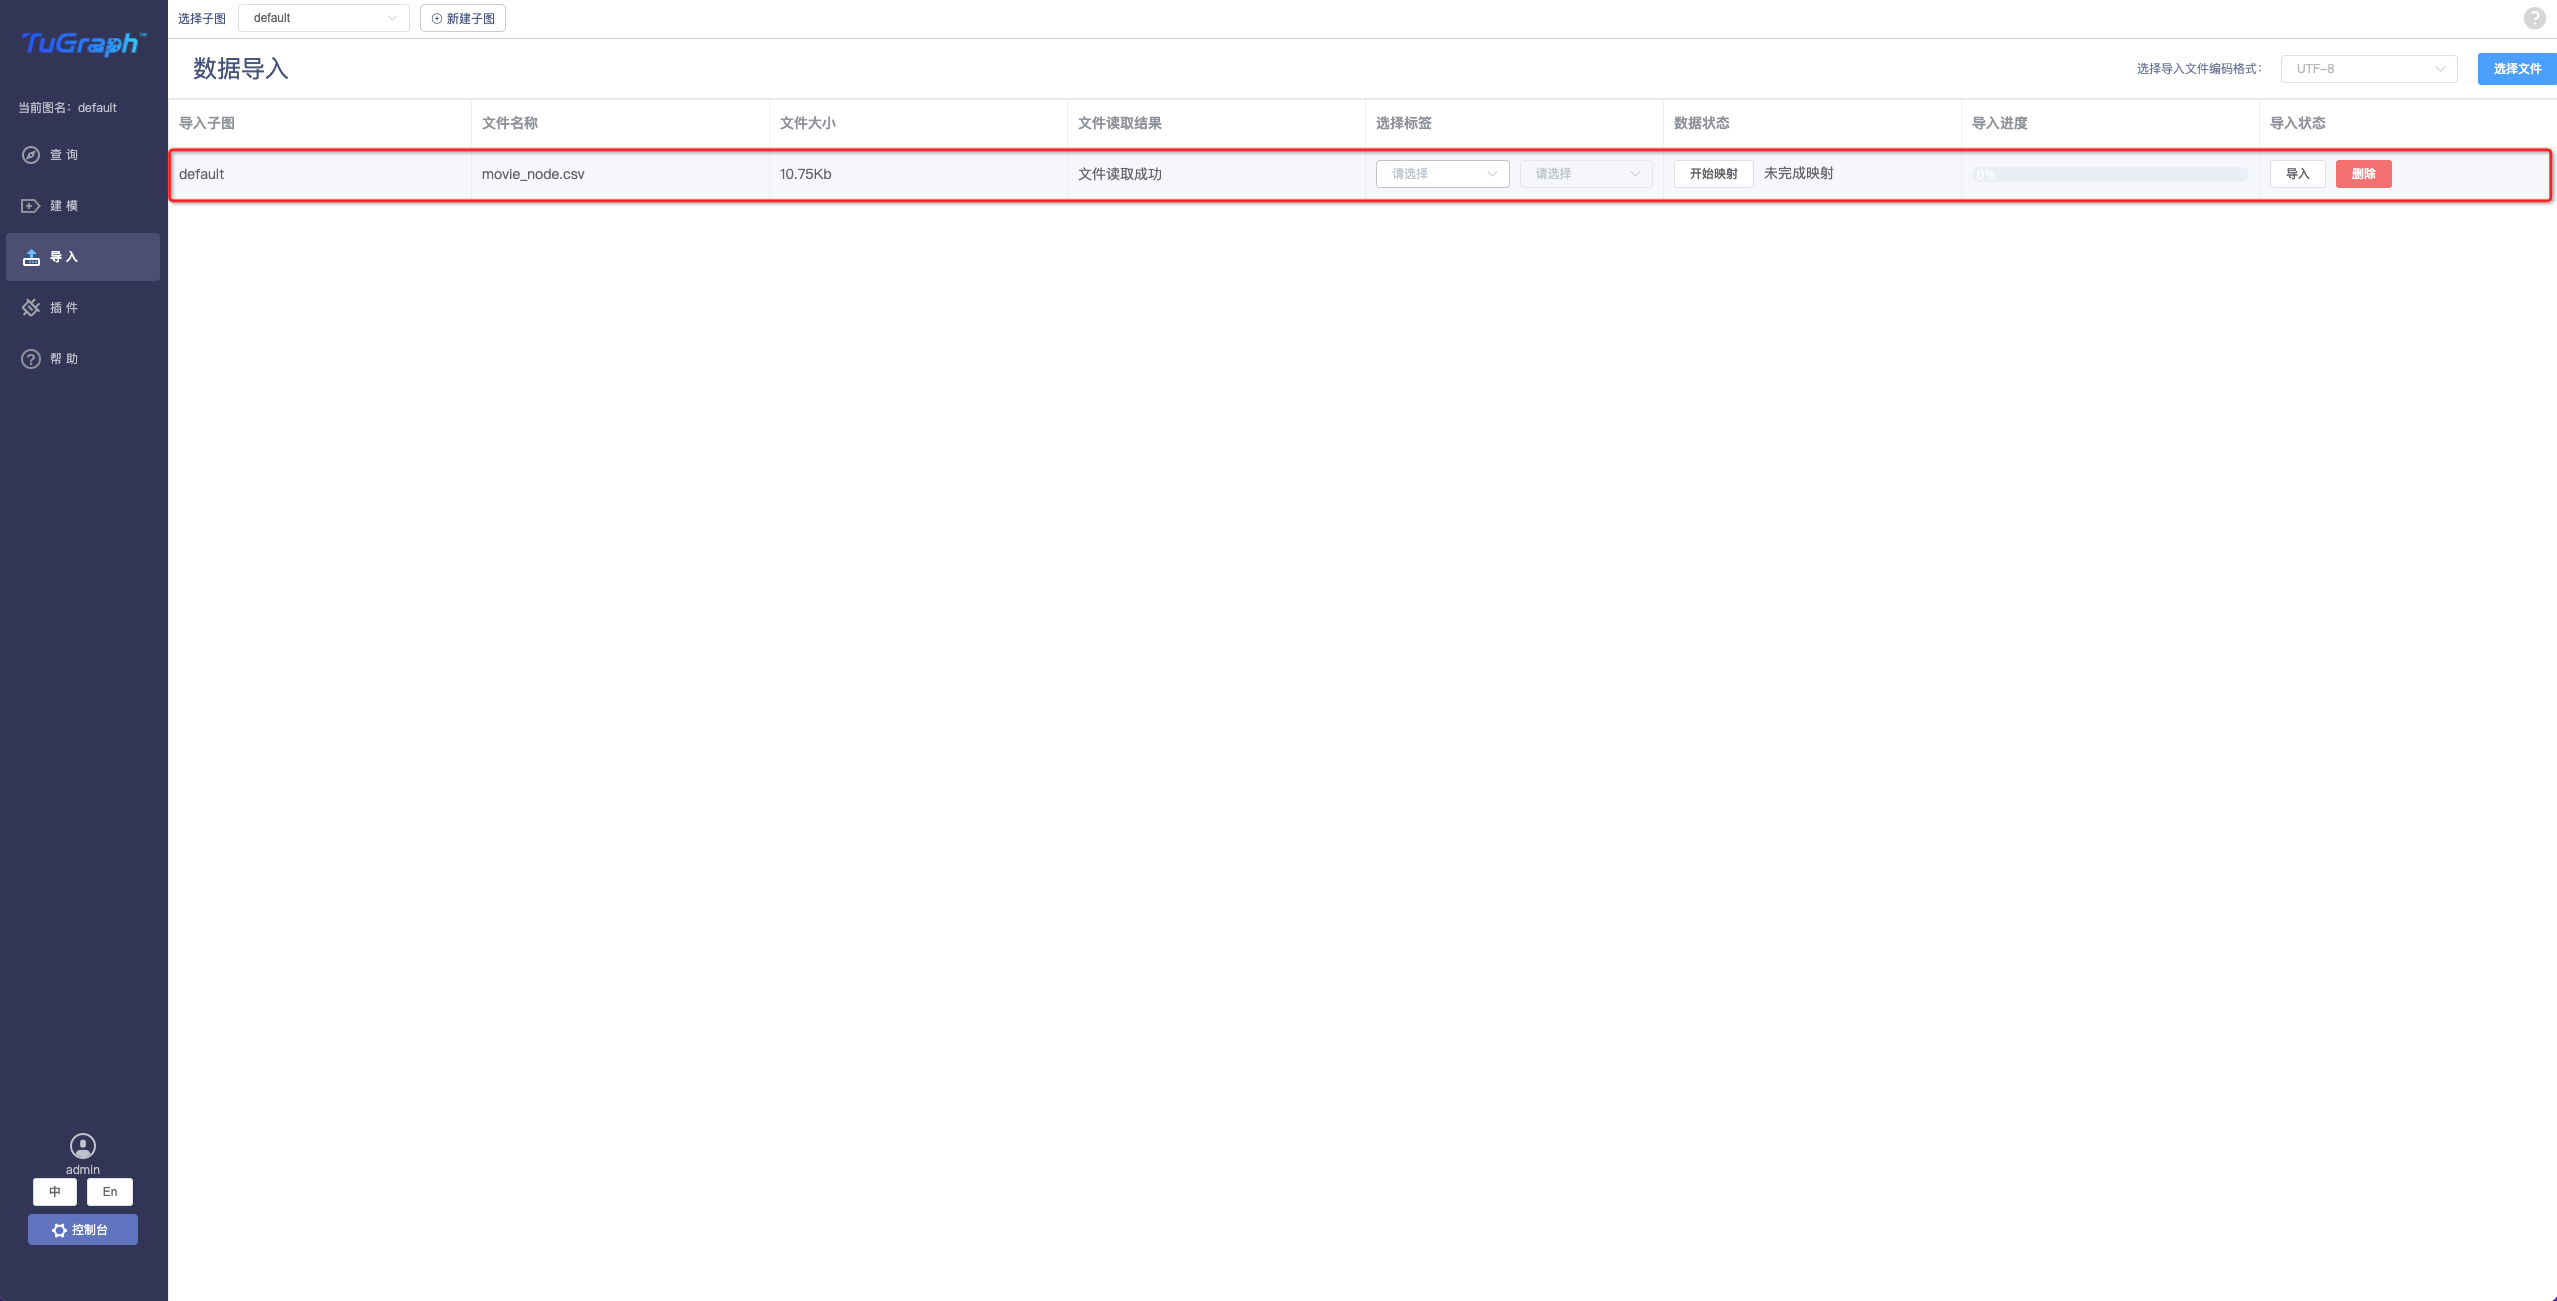
Select the file encoding format
Select a local CSV file
Select the model for the corresponding node or edge
Do the data mapping
Complete the data import
The maximum supported size for a single file is 2GB.
3.3.5 plug-in (Stored Procedure)
Use of plug-ins
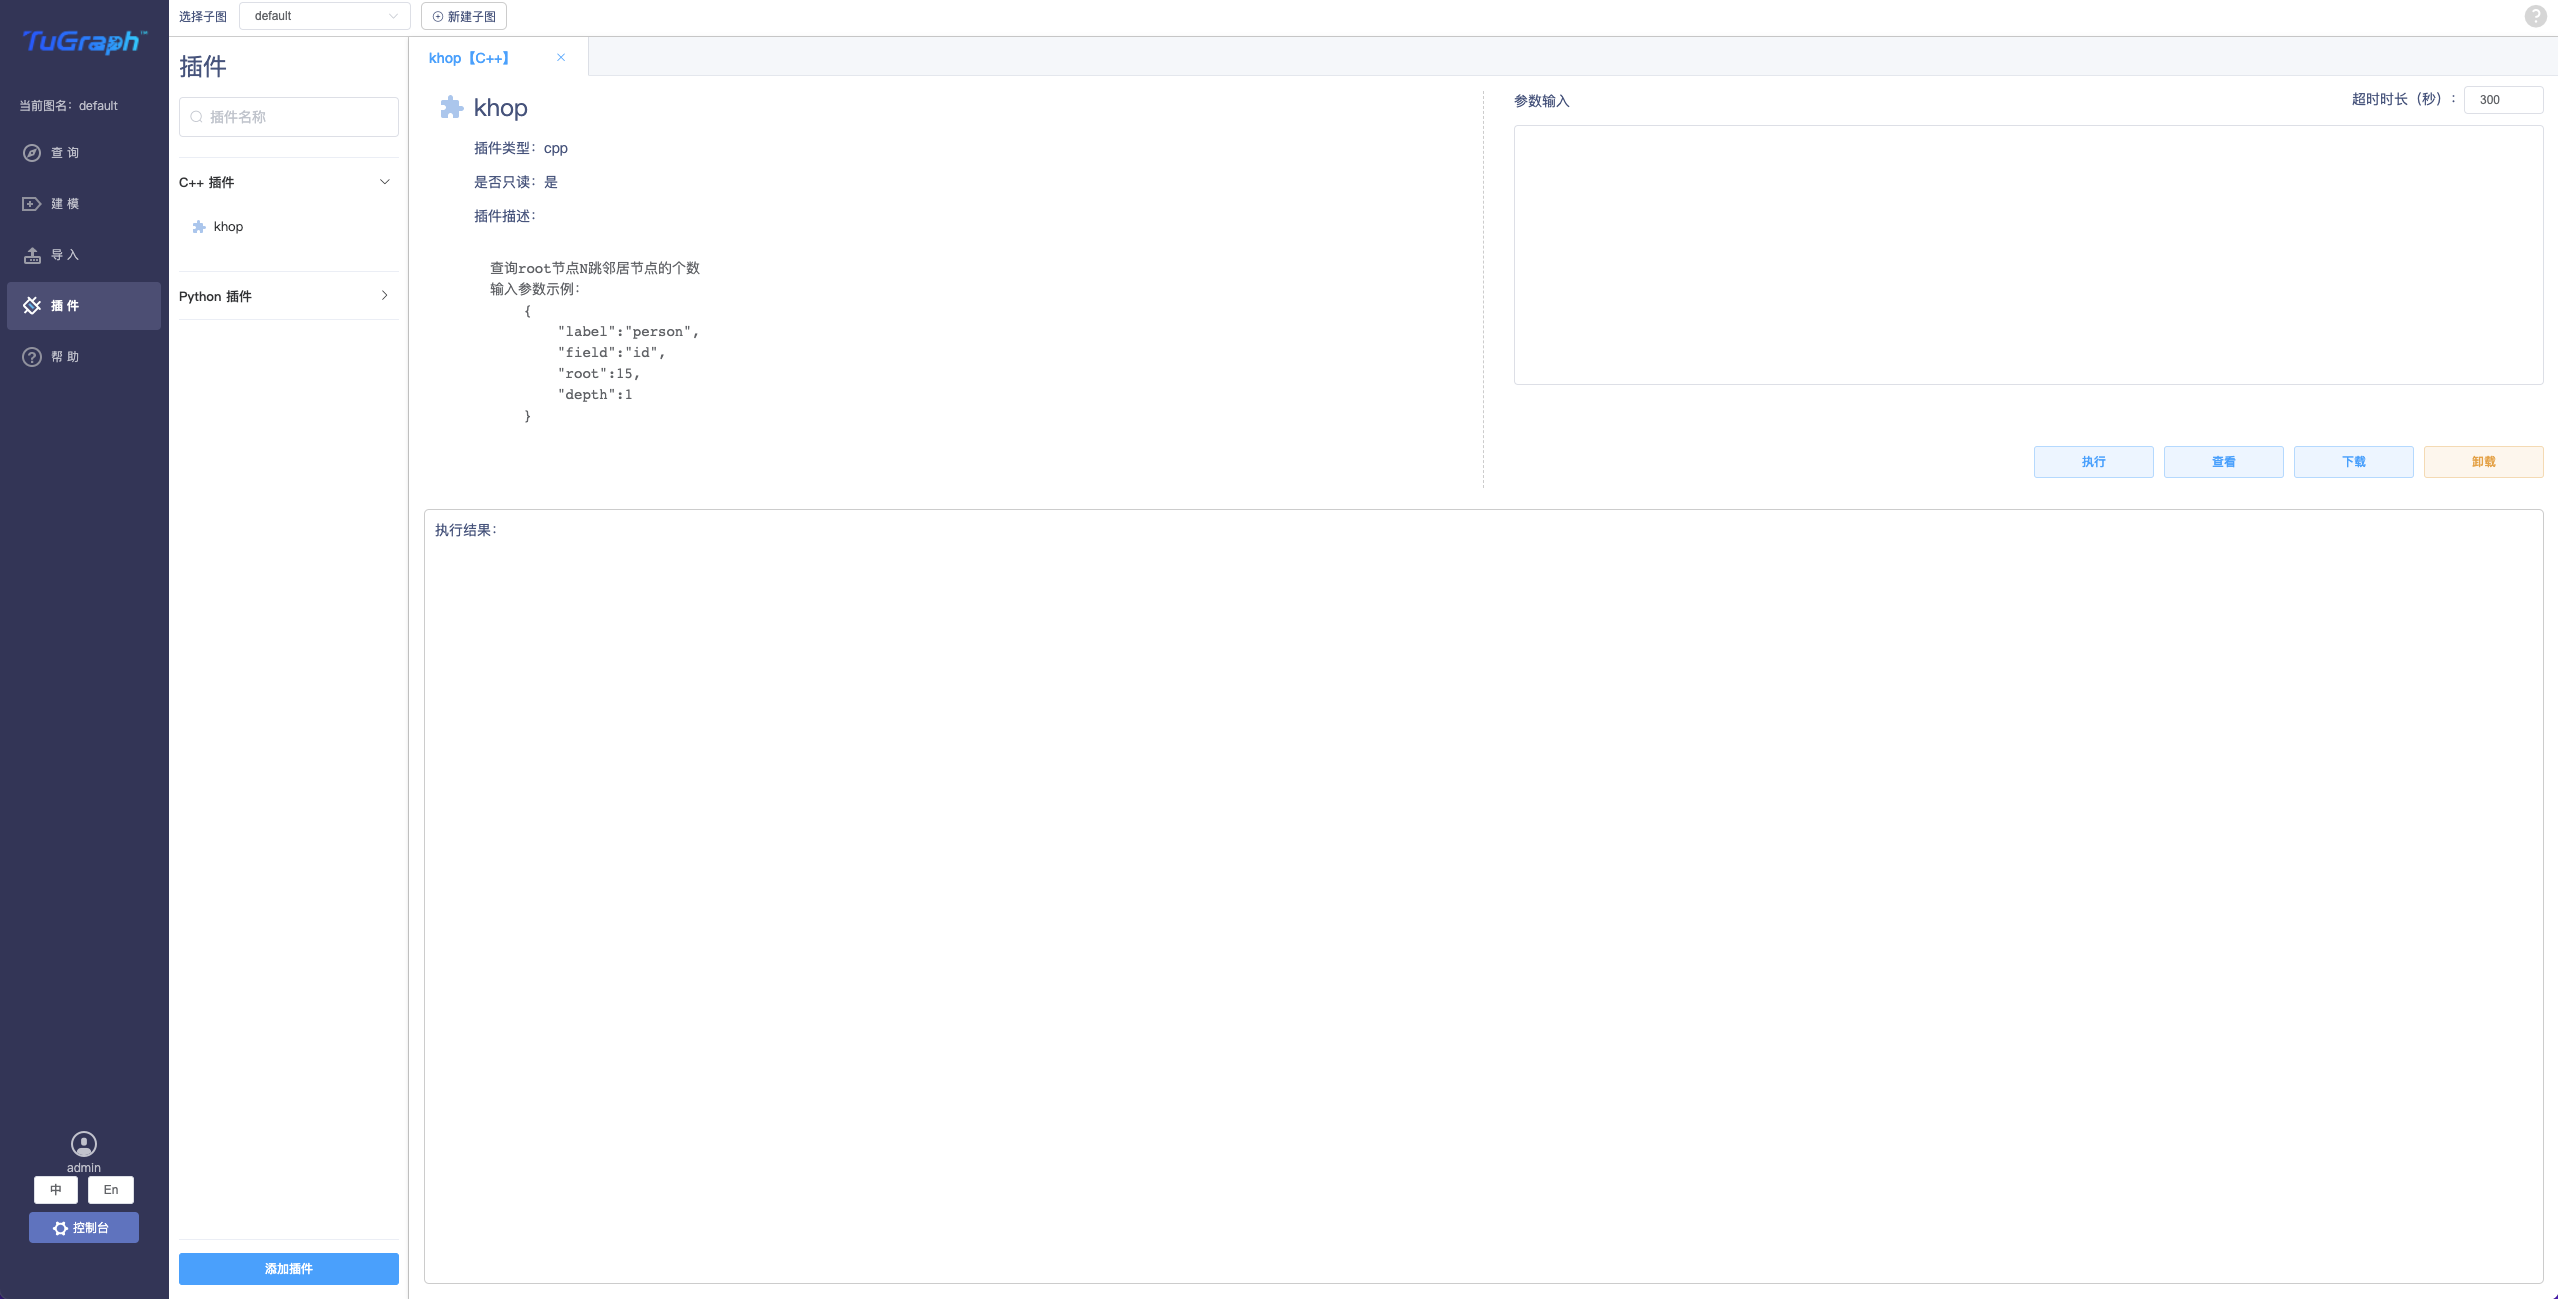
Users can upload the plug-in program written locally, execute it in the visual page, and view the execution result
Users can perform, uninstall, execute, and download plug-ins in the visualization page
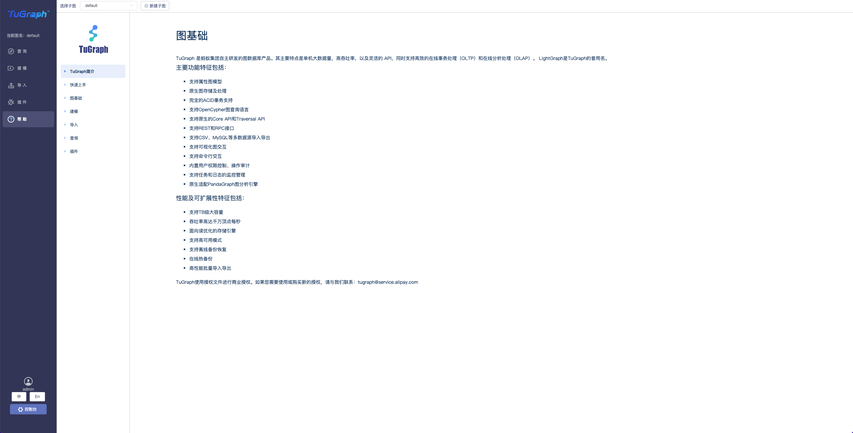
3.3.6 Help
where it records how TuGraph-browser is used
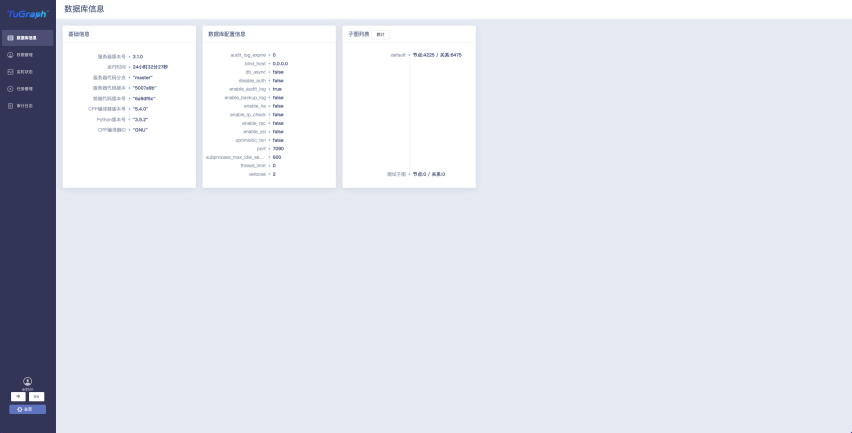
3.4 Console
3.4.1 Basic database information
Displays basic database configuration information
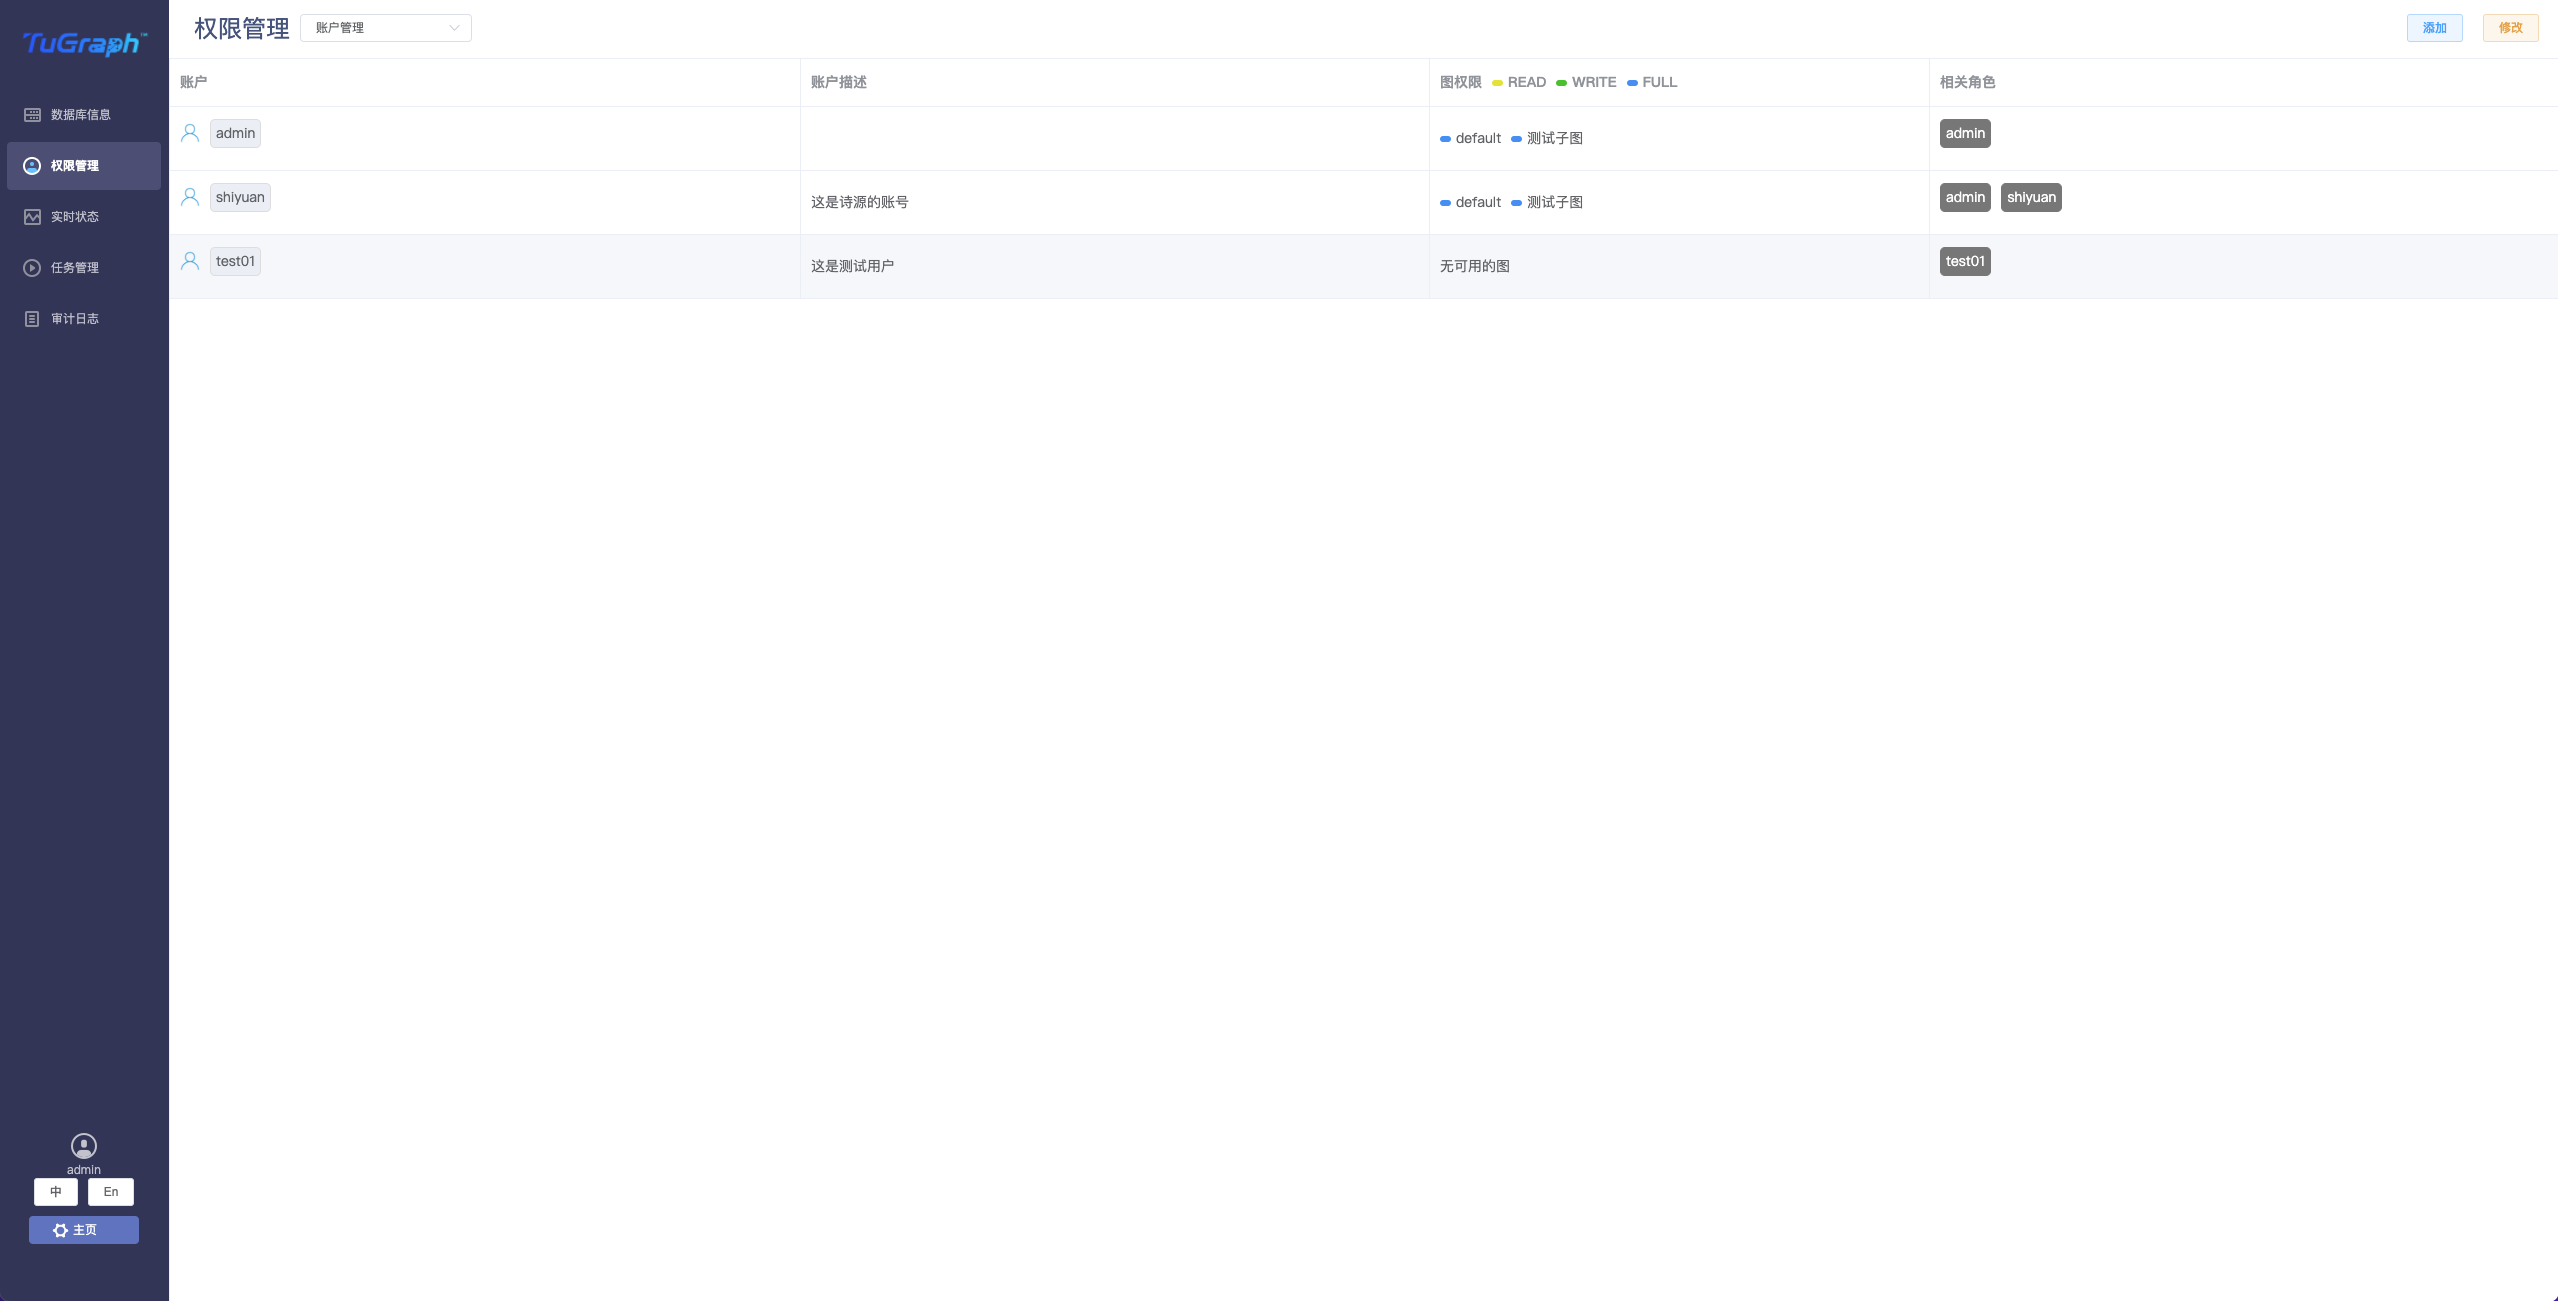
3.4.2 Permission management
A function module used to create users and roles. Users can manage permissions here
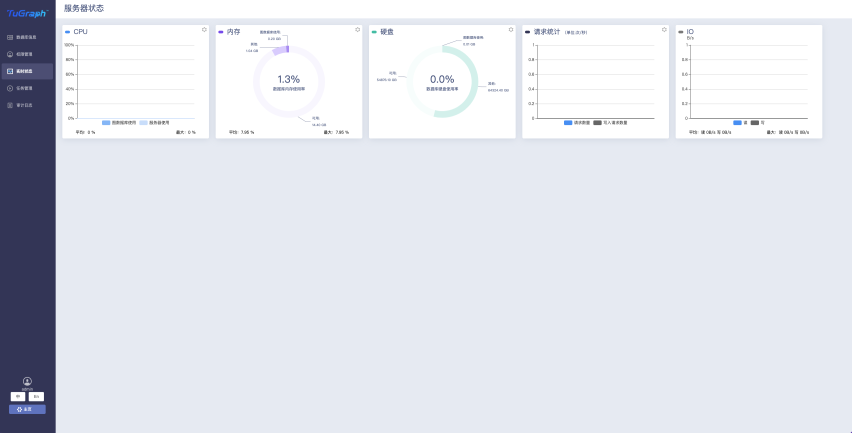
3.4.3 Live status
This shows the database real-time status, including: CPU usage, memory usage, disk usage, number of data requests, disk IO
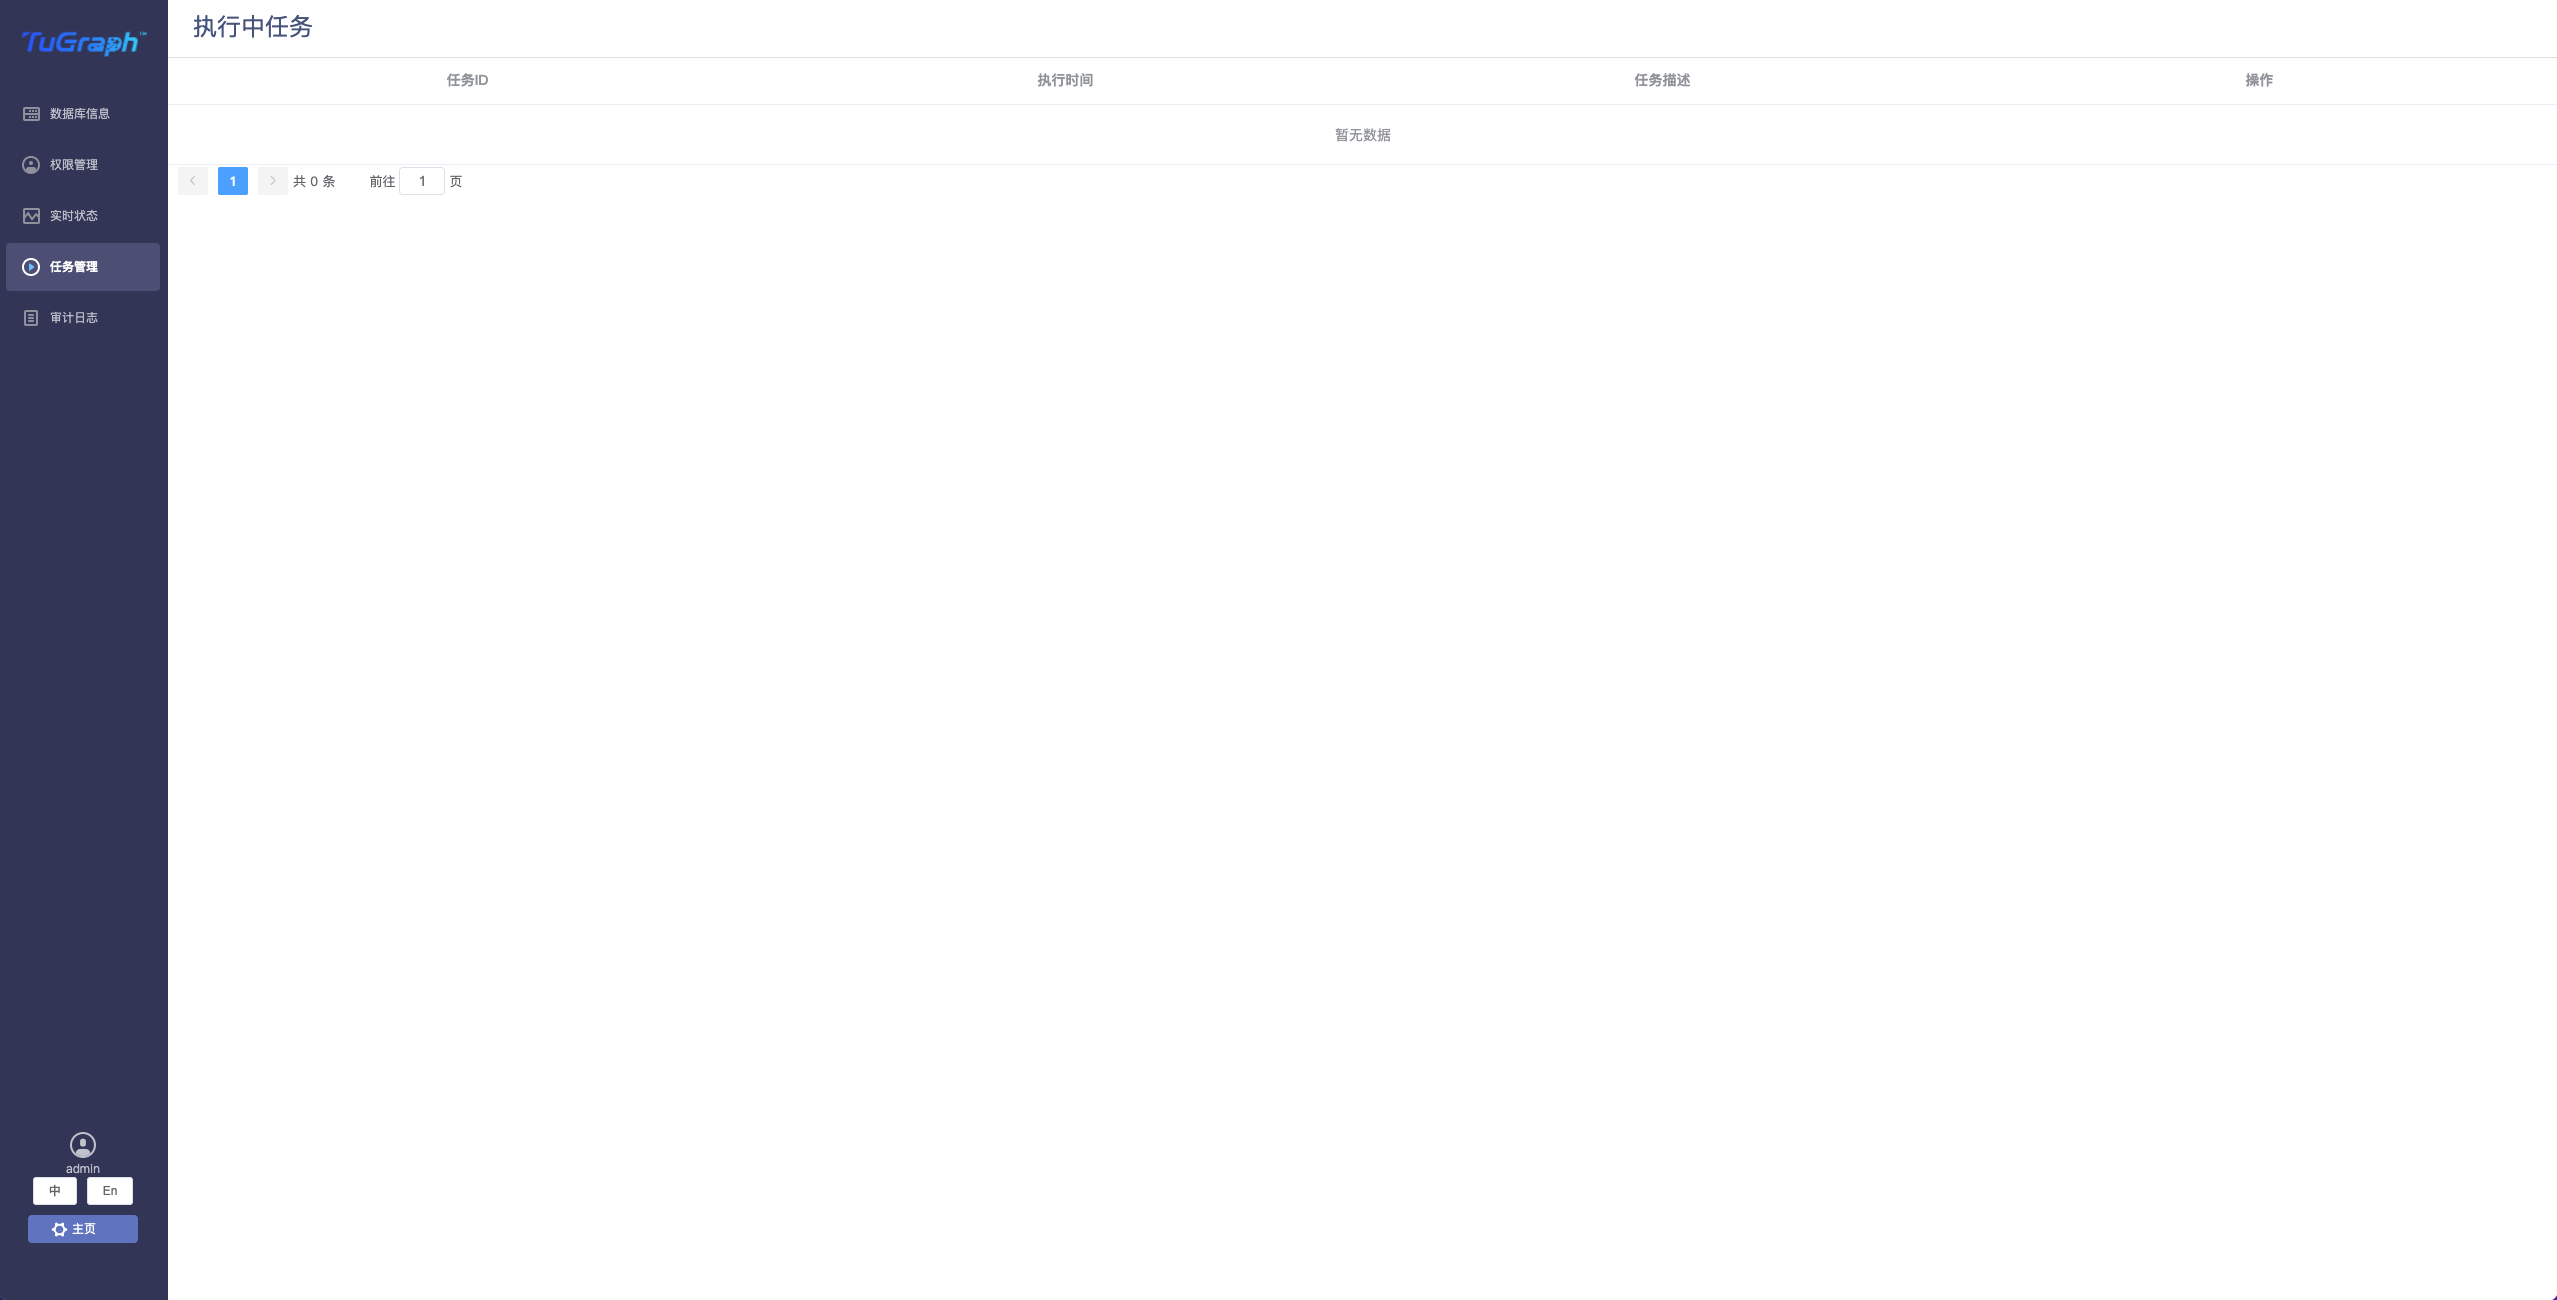
3.4.4 Task Management
Here the user can see the task in execution and stop the task
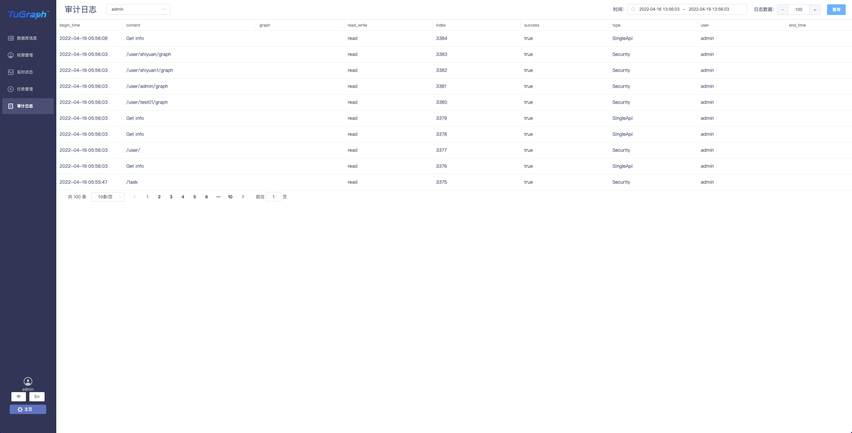
3.4.5 Audit logs
Database related audit logs recorded here, used to troubleshoot problems encountered in use